Digital map production
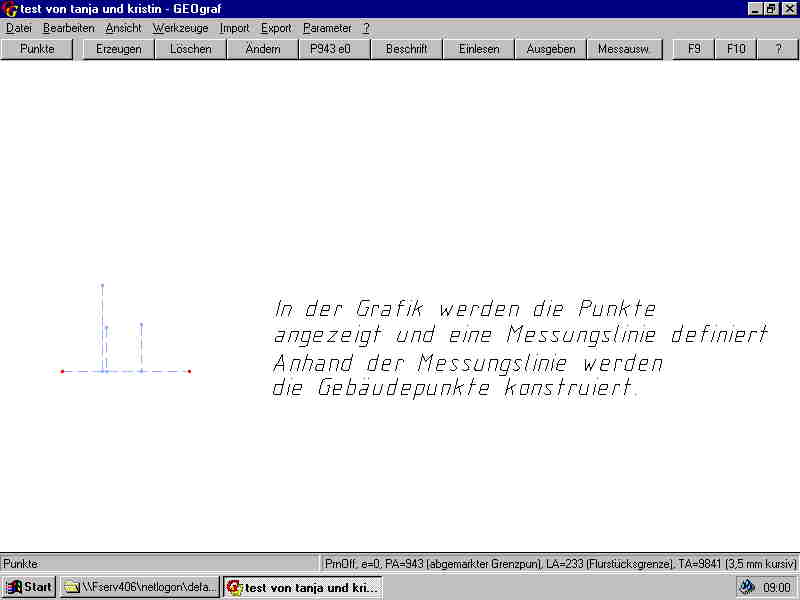
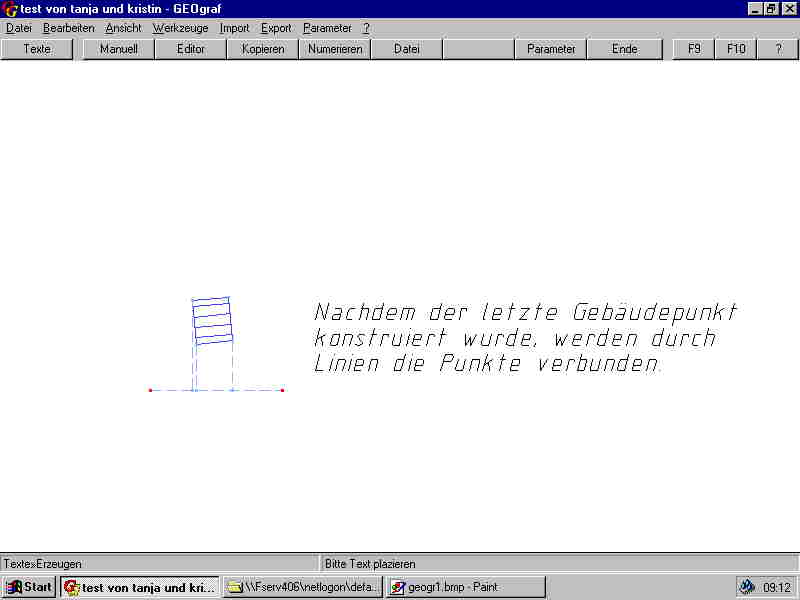
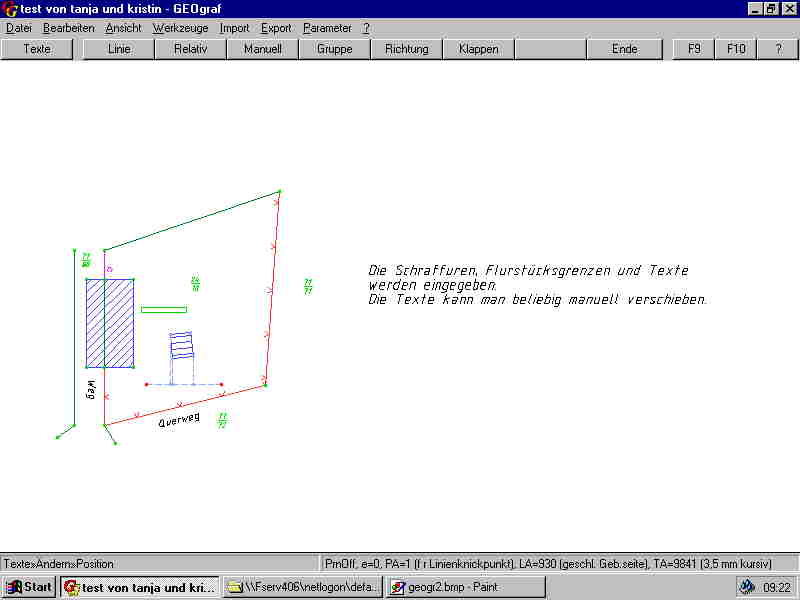
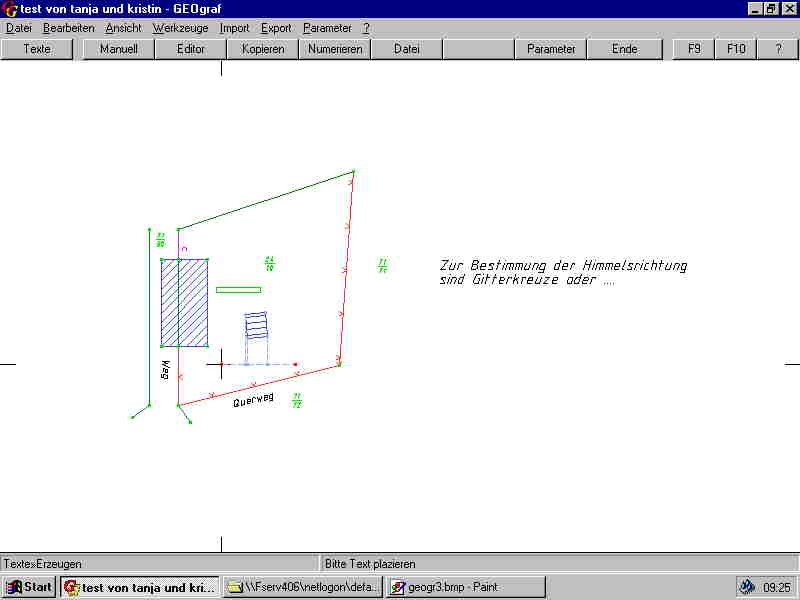
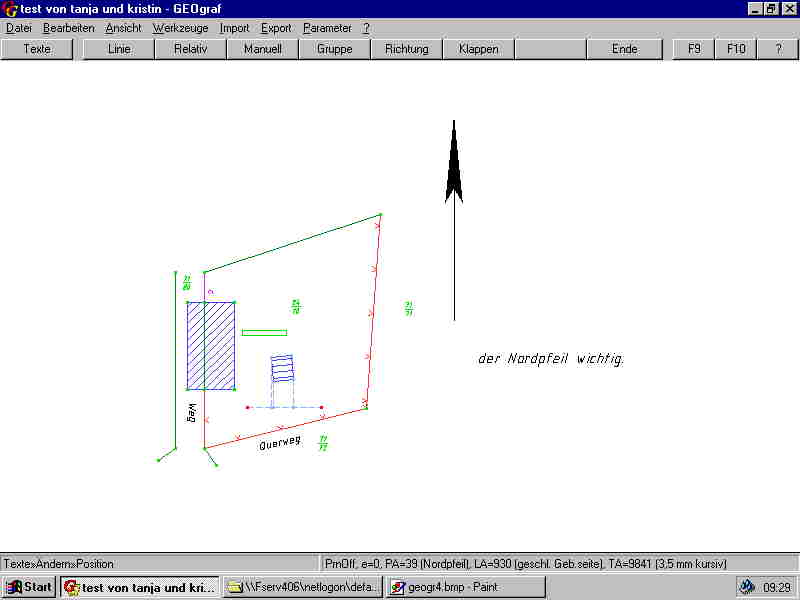
After points are messured in the field work and in the office work a file for the points is created, the points (in our case) are transformed and read in in GEOgraf (GEOgraf is a product of HHK Datentechnik GmbH). In the window "parameter of display" you can set the maximum display window, the measuring unit, colours and symboles arbitrarily.In the graphics the pointtype can be changed as the measuring documentations provide it. With help of the menu bar on the top margin points, lines and texts can be changed, produced and deleted if necessary. Constructions of buildings are also possible. You can map with distance intersection, area divide etc. The display window is variable, it can be enlarged, shortened or show the total map on the monitor. Topographically important objects like trees, wind break areas, dikes, lakes etc., can be represent differently.
1. Schritt 2. Schritt 3. Schritt 4. Schritt 5. Schritt
The work with digital data has become an important area for surveying and mapping. It is used when maps, construction plans, sketches etc. are made automatically. The digital representations serve either as samples or are the results of a digital work.
Material: Eike Gebauer, Tobias Witte, Caty Chadhuri, Melanie Wetzel, VT98, Juni 1999
HTML: Tanja Wilkens und Kristin Kraft VT 99 10.07.2000
English version by Denis Kavurmaci
Back